CODE
before starting the document.
          \usepackage{tikz}
          \usepackage{pgfplot}
\usepackage{tikz}
\usepackage{pgfplot}
         \begin{tikzpicture}
         \begin{axis}[option of the axis]
         ...
         \end{axis}
         \end{tikzpicture}
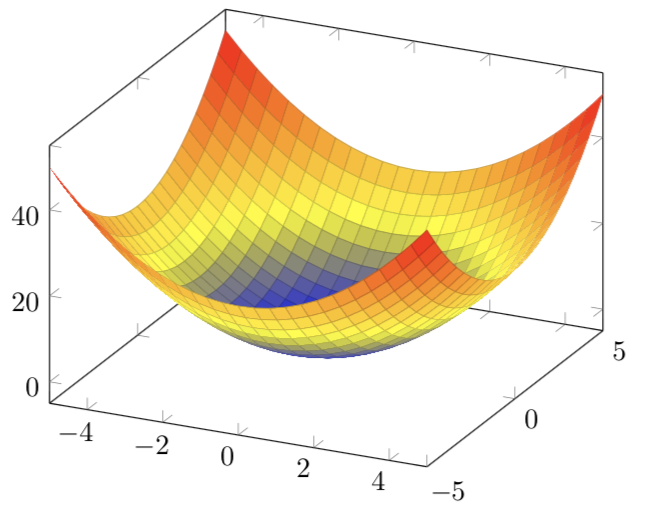
      \begin{tikzpicture}
      \begin{axis}
      \addplot3[surf,]{x^2+y^2};
      \end{axis}
      \end{tikzpicture}
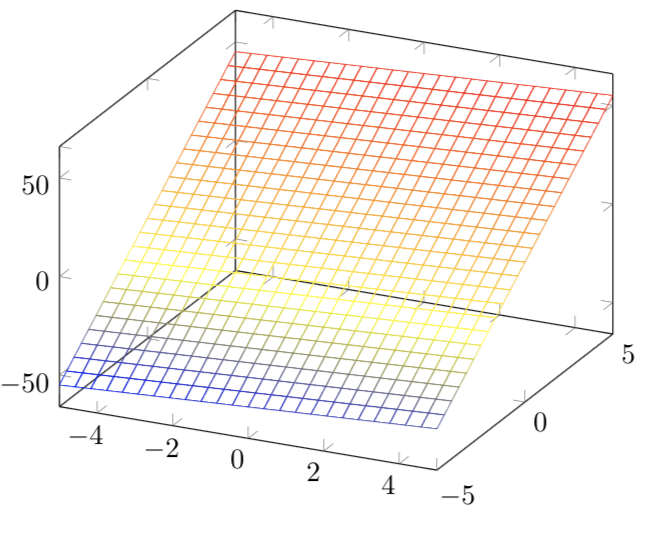
 There is also the possibility to draw the function as a grid instead of a surface, change
[surf,] to [mesh,]:
There is also the possibility to draw the function as a grid instead of a surface, change
[surf,] to [mesh,]:
    \begin{tikzpicture}
    \begin{axis}
    \addplot3[mash,]{x+10*y};
    \end{axis}
    \end{tikzpicture}
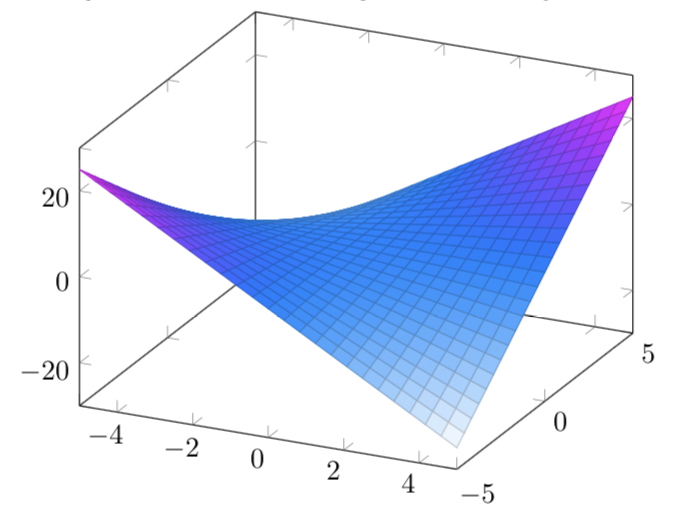
 We can change even the color, add in the option [colormap/cool]:
   \begin{tikzpicture}
   \begin{axis}
   \addplot3[surf, colormap/cool]{x*y};
   \end{axis}
   \end{tikzpicture}
 After the option colormap/ we can use other predefine extension, here are other possible
parts: hot, hot2, jet, blackwhite, bluered, greenyellow, redyellow, violet.
After the option colormap/ we can use other predefine extension, here are other possible
parts: hot, hot2, jet, blackwhite, bluered, greenyellow, redyellow, violet.
      \begin{tikzpicture}
      \begin{axis}
      \addplot3[surf,]
      coordinates {
      (0,0,0) (0,1,0) (0,0.5,0)
      (1,0,0) (1,1,1) (1,2,2)
      (2,0,0) (2,1,1) (2,2,2)};
      \end{axis}
      \end{tikzpicture}

Now try to display the function: f(x,y)=x+y^3 for the solution move the mouse over the black box on the right
              \begin{tikzpicture}
              \begin{axis}
              \addplot3[surf,]{x+y^3};
              \end{axis}
              \end{tikzpicture}