CODE
            \usepackage{tikz}
            \usepackage{pgfplot}
\usepackage{tikz}
\usepackage{pgfplot}
          \begin{tikzpicture}
	         \begin{axis}[option of the axis]
          ...
          \end{axis}
          \end{tikzpicture}
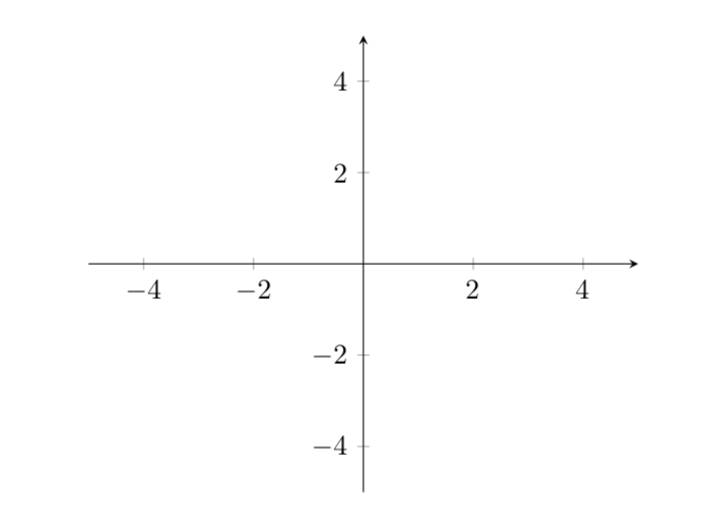
          \begin{tikzpicture}
	         \begin{axis}[xmin=-5, xmax=5, ymin=-5, ymax=5, axis x line=middle, axis y line=middle]

          \end{axis}
          \end{tikzpicture}
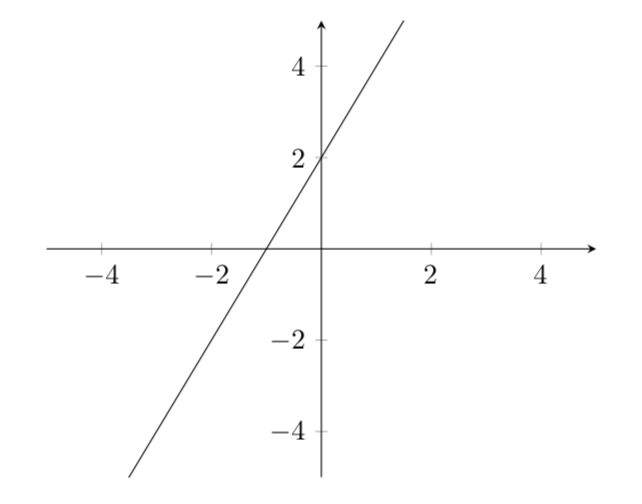
        \begin{tikzpicture}
         \begin{axis}[xmin=-5, xmax=5, ymin=-5, ymax=5, axis x line=middle, axis y line=middle]
        \addplot[domain=-5:5]{2*x+2};
        \end{axis}
        \end{tikzpicture}
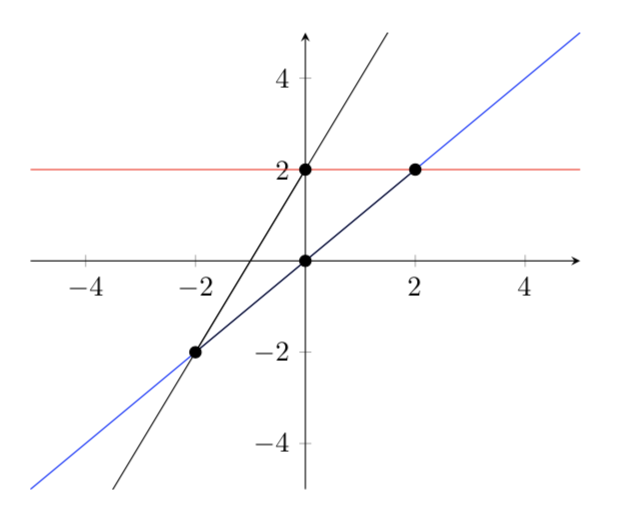
 We can also add more than one function in a single graph, to do this we just add another
\addplot[]{}; in the same environment. When adding multiple function in a graph is better
to distinguish them, Latex allow us to choose a color for each function. Now we will add
two more function, one with a red line and one with a blue line:
We can also add more than one function in a single graph, to do this we just add another
\addplot[]{}; in the same environment. When adding multiple function in a graph is better
to distinguish them, Latex allow us to choose a color for each function. Now we will add
two more function, one with a red line and one with a blue line:
      \begin{tikzpicture}
       \begin{axis}[xmin=-5, xmax=5, ymin=-5, ymax=5, axis x line=middle, axis y line=middle]
      \addplot[domain=-5:5]{2*x+2};
      \addplot[domain=-5:5, color=red]{2*x+2};
      \addplot[domain=-5:5, color=blue]{2*x+2};
      \end{axis}
      \end{tikzpicture}

            \begin{tikzpicture}
            \begin{axis}[xmin=-5, xmax=5, ymin=-5, ymax=5, axis x line=middle, axis y line=middle]
            \addplot[domain=-5:5]{2*x+2};
            \addplot[domain=-5:5, color=red]{2*x+2};
            \addplot[domain=-5:5, color=blue]{2*x+2};
            \addplot[matk=*] coordinates {(2,2)};
            \addplot[matk=*] coordinates {(0,0)};
            \addplot[matk=*] coordinates {(-2,-2)};
            \addplot[matk=*] coordinates {(0,2)};
            \end{axis}
            \end{tikzpicture}
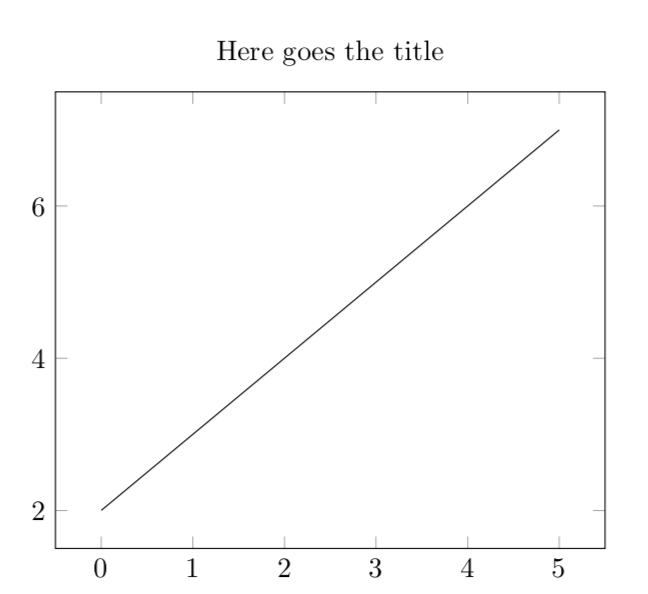
        \begin{tikzpicture}
        \begin{axis}[title=Here goes the title]
        \addplot[domain=0:5]{x+2};
        \end{axis}
        \end{tikzpicture}
Now that you know the basic try to draw the function: F(x)=x^2 -4 and put 2 dot where the function intersect with the x axis. For the solution move the mouse over the black box on the right side.
                  \begin{tikzpicture}
                  \begin{axis}[xmax=5, xmin=-5, ymax=5, ymin=-5, axis x line=middle, axis y line=middle]
                  \addplot[domain=-5:5]{x^2-4};
                  \addplot[mark=*] coordinates {(-2,0)};
                  \addplot[mark=*] coordinates {(2,0)};
                  \end{axis}
                  \end{tikzpicture}